
How Charts Lie
- Estefany Saez-Clarke
- Aug 26, 2019
- 3 min read

I just finished the first week of my 5th year of grad school (and final before leaving for internship). Since I began the program, I’ve had two research mentors leave the university and had to adapt my research interests to new settings. However, one interest has remained constant: how to best disseminate research findings with the goal of decreasing the 17-year gap between research and practice. Right now, I am focused on learning how to better share information in a way that is easy to read and captures the attention of the reader, so I am taking a class on Infographics and Data Visualization.
This weekend, I started reading How Charts Lie by Dr. Alberto Cairo. The book's introduction talked about how data can be misrepresented through the use of charts that distort the data (either intentionally or by mistake). Dr. Cairo writes, "I've learned never to attribute to malice what could be more easily explained by absentmindedness, rashness, or sloppiness.” This may be true, but there are situations that make it more difficult for me to give the author/presenter of the data the benefit of the doubt… like when millions upon millions of dollars are at stake related to the approval and use of a new pharmaceutical product.
For three years, including the first two years of grad school, the focus of my research was on improving psychological and physical health outcomes in individuals with cystic fibrosis (CF). For those who aren’t familiar with CF, it is a life-shortening, progressive, genetic condition. Until this decade, there were no medications that targeted the actual genetic cause of CF. In 2012, a medication called Kalydeco (ivacaftor) was approved by the FDA and became available to individuals with CF with a specific mutation (~4%). This medication was the first to treat the genetic malfunction instead of just the symptoms and showed promising results. It was a huge deal in the CF community and provided hope to the thousands of individuals living with CF. However, the annual cost of this drug was around $300,000 per person!
The following chart demonstrates the results of the clinical trial for Kalydeco.
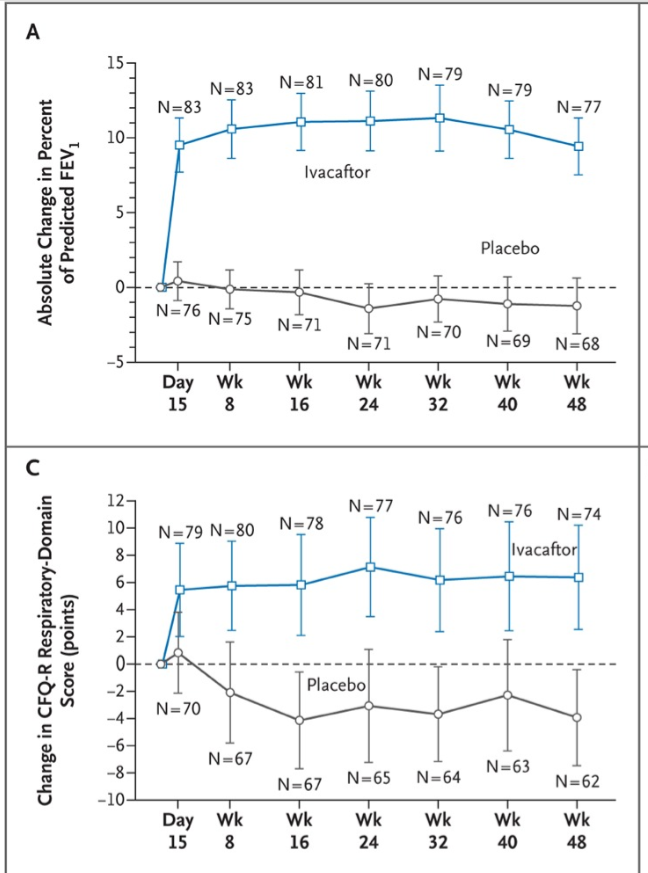
To understand the significance of the results, it's important to note that as a progressive illness, the goal of CF medications up to that point was to maintain the patient's current level of lung function and to slow the progression of the illness. But my issues isn't with Kalydeco, despite its ridiculously high cost.
Reading this chapter took me back to the keynote talk at the North American CF Conference in 2016, where Vertex (the same company that produces Kalydeco) presented the results of its clinical trial for a new medication, this one targeting the most common mutation in CF, deltaF508.
The charts for the Kalydeco results were shown in the presentations slides during this presentation. Then followed by the results for the new drug, Orkambi (ivacaftor+lumacaftor), presented below.

The audience, which consisted of researchers, doctors, and other healthcare providers responded with applause/cheers. (On a side note, only one person with CF is allowed to attend the conference due to infection control guidelines). The use of these charts told more than one message; one was explicitly stated: The new drug works! The second was implied: almost as well as Kalydeco! The response of the audience, which was mostly researchers in the field, hinted that no one closely examined the charts. However, there is one large and very important difference between the two: the y-axis.
The y-axis in the Kalydeco table for lung function (predicted FEV1%) ranged from -5 to 15 and the the overall difference in lung function was 10.6% In contrast, the y-axis for the Orkambi chart was -2 to 6. The actual overall difference in lung function was 2.6 for one treatment group and 4.0% for the second (Wainwright et al., 2016, New Eng J of Medicine).
In addition, results for the patient-reported outcome measure difference in respiratory symptoms (CFQ-R Respiratory) was ~8% for Kalydeco by week 48. The chart for Orkambi was not presented (or included in the main text of the full research article). I found it on page 17 of the supplementary (online only) appendix: the difference was only 2.2 or 3.1%.
The implications for the way these results were interpreted were not small!
Kalydeco had been on the market for about four years at the time of this talk and the overall feedback from patients, families, and doctors was positive, despite its $300k price tag. Orkambi came on the market at around $250,000/year per patient. Because of the results of the clinical trial, governments with national health care systems were reluctant to accept Orkambi and thousands of individuals felt as though they were being deprived from a life-saving medication.
If the research experts at a conference weren't able to grasp the discrepancy in outcomes between these two medications, how can we expect patients and families to do so?


Comments